通用基准测试调试工具
此 notebook 演示了调试模式,用于区分文本和图像解释在不同输出结果上的性能。在多输出 token / 类别的情况下,通常查看任何异常值的个体性能会很有用。
此 notebook 包含文本和图像的调试示例。
文本示例 (摘要)
请参考 “Abstractive Summarization Benchmark Demo.ipynb” 以获得关于此基准测试示例的更多描述。
[1]:
import matplotlib.pyplot as plt
import nlp
import numpy as np
from transformers import AutoModelForSeq2SeqLM, AutoTokenizer

import shap
import shap.benchmark as benchmark

%matplotlib inline
[2]:
tokenizer = AutoTokenizer.from_pretrained("sshleifer/distilbart-xsum-12-6")
model = AutoModelForSeq2SeqLM.from_pretrained("sshleifer/distilbart-xsum-12-6")
[3]:
dataset = nlp.load_dataset("xsum", split="train")
Using custom data configuration default
[4]:
s = dataset["document"][0:1]
[5]:
explainer = shap.Explainer(model, tokenizer)
explainers.Partition is still in an alpha state, so use with caution...
[6]:
shap_values = explainer(s)
Partition explainer: 2it [00:19, 9.59s/it]
[7]:
sort_order = "positive"
perturbation = "keep"
[8]:
sequential_perturbation = benchmark.perturbation.SequentialPerturbation(
    explainer.model, explainer.masker, sort_order, perturbation
)
mask_vals, curves, aucs = sequential_perturbation.model_score(shap_values, s, debug_mode=True)
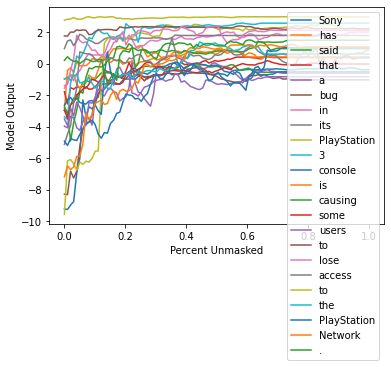
[9]:
xs = np.linspace(0, 1, 100)
for index in range(len(curves)):
    plt.plot(xs, curves[index, :], label=f"{shap_values.output_names[0][index]}")
    plt.ylabel("Model Output")
    plt.xlabel("Percent Unmasked")
    plt.legend()
plt.show()
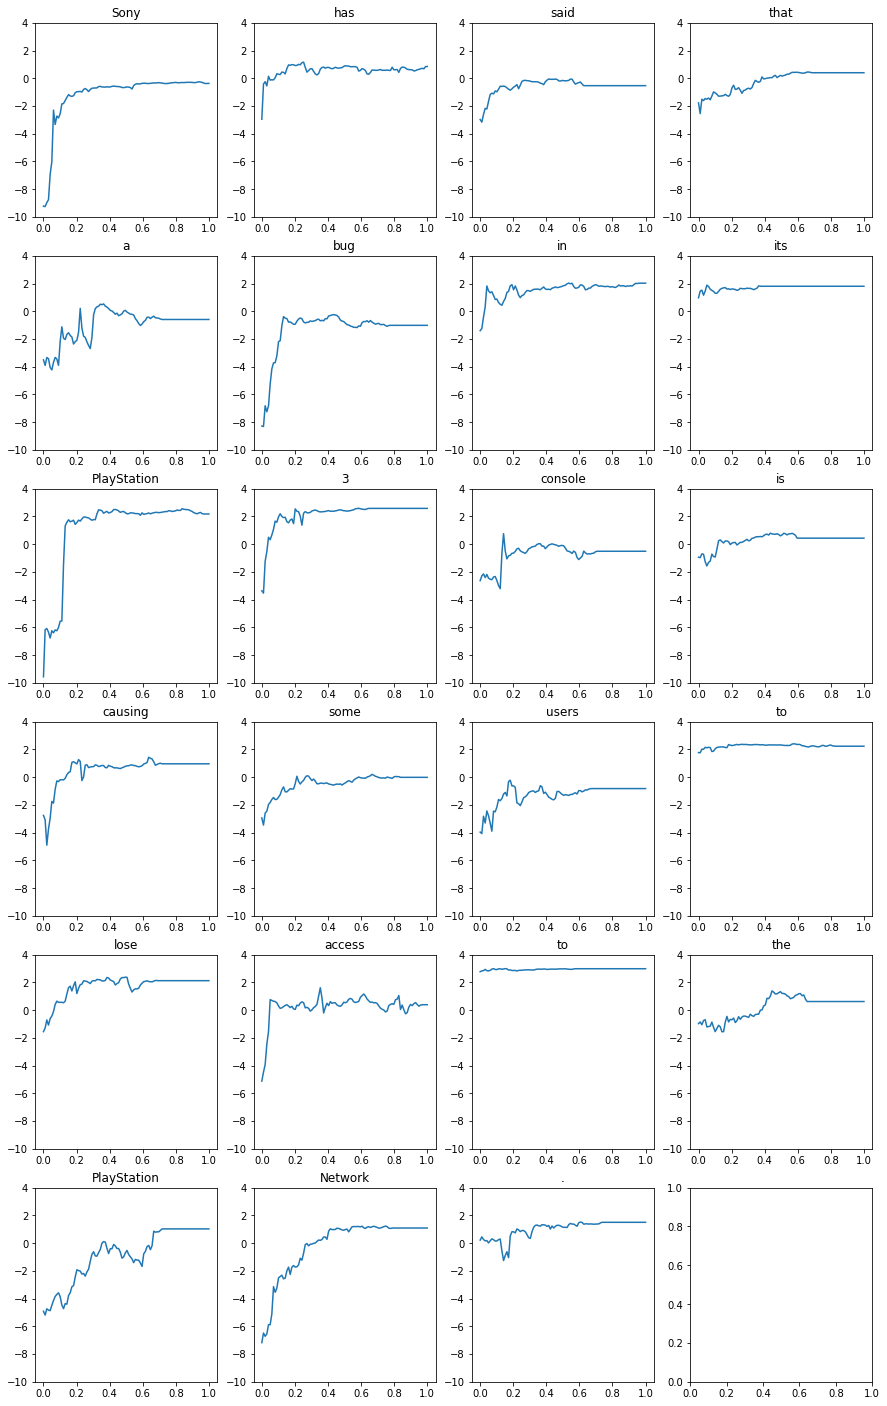
[10]:
fig, axs = plt.subplots(6, 4, figsize=(15, 25))
xs = np.linspace(0, 1, 100)
for index in range(len(curves)):
    x = index // 4
    y = index % 4
    axs[x, y].plot(xs, curves[index, :])
    axs[x, y].set_title(f"{shap_values.output_names[0][index]}")
    axs[x, y].set_ylim(-10, 4)
plt.show()
图像示例 (多类别)
请参考 “Image Multiclass Classification Benchmark Demo.ipynb” 以获得关于此基准测试示例的更多描述。
[11]:
import json

import matplotlib.pyplot as plt
import numpy as np
from tensorflow.keras.applications.resnet50 import ResNet50, preprocess_input

import shap
import shap.benchmark as benchmark

%matplotlib inline
[12]:
model = ResNet50(weights="imagenet")
X, y = shap.datasets.imagenet50()
[13]:
url = "https://s3.amazonaws.com/deep-learning-models/image-models/imagenet_class_index.json"
with open(shap.datasets.cache(url)) as file:
    class_names = [v[1] for v in json.load(file).values()]
[14]:
def f(x):
    tmp = x.copy()
    if len(tmp.shape) == 2:
        tmp = tmp.reshape(tmp.shape[0], *X[0].shape)
    preprocess_input(tmp)
    return model(tmp)
[15]:
masker = shap.maskers.Image("inpaint_telea", X[0].shape)
[16]:
explainer = shap.Explainer(f, masker, output_names=class_names)
explainers.Partition is still in an alpha state, so use with caution...
[17]:
shap_values = explainer(X[1:3], max_evals=500, batch_size=50, outputs=shap.Explanation.argsort.flip[:4])
Partition explainer: 50%|█████████████████ | 1/2 [00:00<?, ?it/s]
Partition explainer: 3it [01:01, 20.59s/it]
[18]:
output = f(X[1:3]).numpy()
num_of_outputs = 4
sorted_indexes = np.argsort(-output, axis=1)
sliced_indexes = np.array([index_list[:num_of_outputs] for index_list in sorted_indexes])
[19]:
# getting output labels
labels = np.array(class_names)
sliced_labels = np.array([labels[index_list[:num_of_outputs]] for index_list in sorted_indexes])
[20]:
sort_order = "positive"
perturbation = "keep"
[21]:
sequential_perturbation = benchmark.perturbation.SequentialPerturbation(
    explainer.model, explainer.masker, sort_order, perturbation
)
mask_vals, curves, aucs = sequential_perturbation.model_score(
    shap_values, X[1:2], indices=sliced_indexes[0], debug_mode=True
)
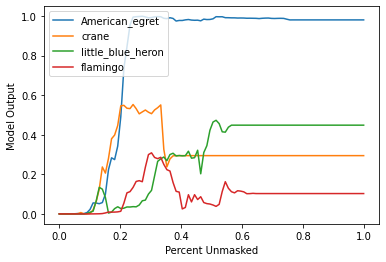
[22]:
xs = np.linspace(0, 1, 100)
for index in range(len(curves)):
    plt.plot(xs, curves[index, :], label=f"{sliced_labels[0][index]}")
    plt.ylabel("Model Output")
    plt.xlabel("Percent Unmasked")
    plt.legend()
plt.show()
[23]:
image = X[1:2][0] / 255
top_class = np.array(mask_vals)[0][0 : int(np.array(mask_vals)[0].shape[0] / num_of_outputs), :]
top_class = top_class.reshape(top_class.shape[0], *X[0].shape)
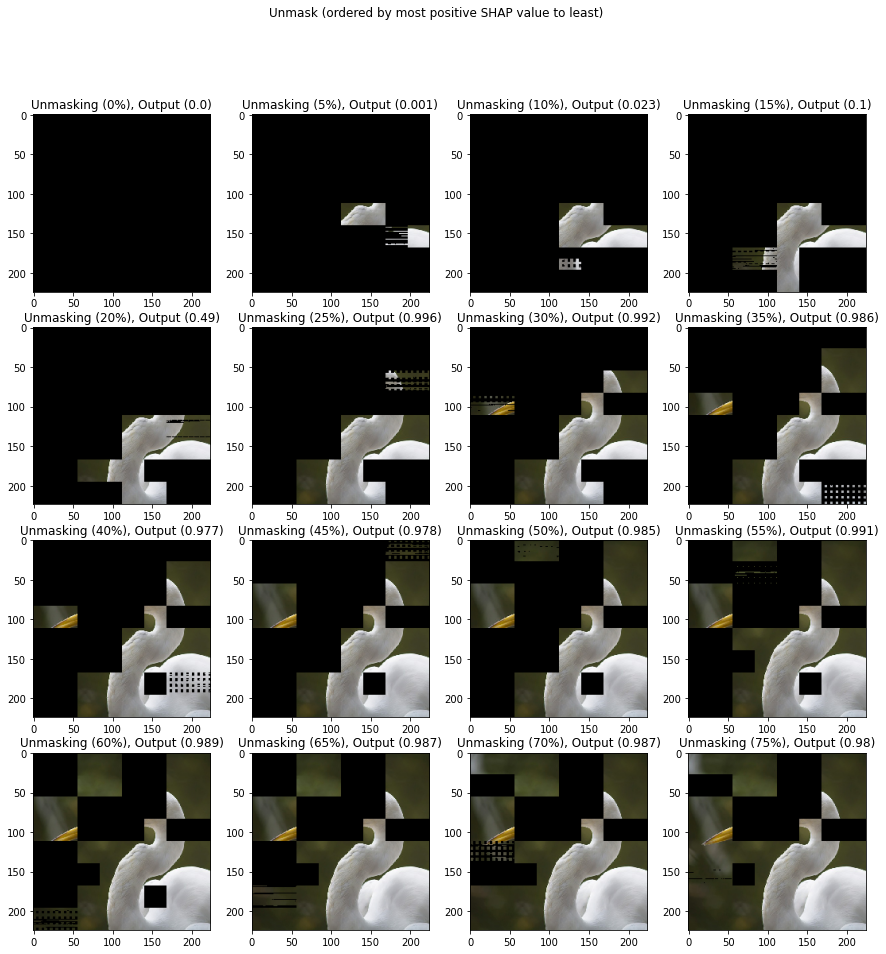
[24]:
masked_image = image * top_class[0].astype(int)
fig, axs = plt.subplots(4, 4, figsize=(15, 15))
for percent in range(0, 80, 5):
    masked_image = image * top_class[percent].astype(int)
    x = percent // 5 // 4
    y = percent // 5 % 4
    axs[x, y].imshow(masked_image)
    axs[x, y].set_title(f"Unmasking ({percent}%), Output ({round(curves[0][percent], 3)})")
fig.suptitle("Unmask (ordered by most positive SHAP value to least)")
plt.show()