在 ImageNet 上解释 VGG16 的中间层 (PyTorch)
用原始输入图像来解释预测结果比用更高的卷积层来解释预测结果更难(因为更高的卷积层更接近输出)。这个 notebook 给出了一个简单的例子,说明如何使用 GradientExplainer 来解释预训练的 VGG16 网络的第 7 层的模型输出。
请注意,默认情况下,会抽取 200 个样本来计算期望值。为了更快地运行,您可以降低每个解释的样本数量。
[1]:
import json

import numpy as np
import torch
from torchvision import models

import shap
[2]:
mean = [0.485, 0.456, 0.406]
std = [0.229, 0.224, 0.225]


def normalize(image):
    if image.max() > 1:
        image /= 255
    image = (image - mean) / std
    # in addition, roll the axis so that they suit pytorch
    return torch.tensor(image.swapaxes(-1, 1).swapaxes(2, 3)).float()
[3]:
# load the model
model = models.vgg16(pretrained=True).eval()
X, y = shap.datasets.imagenet50()
X /= 255
to_explain = X[[39, 41]]
# load the ImageNet class names
url = "https://s3.amazonaws.com/deep-learning-models/image-models/imagenet_class_index.json"
fname = shap.datasets.cache(url)
with open(fname) as f:
class_names = json.load(f)
e = shap.GradientExplainer((model, model.features[7]), normalize(X))
shap_values, indexes = e.shap_values(normalize(to_explain), ranked_outputs=2, nsamples=200)
# get the names for the classes
index_names = np.vectorize(lambda x: class_names[str(x)][1])(indexes)
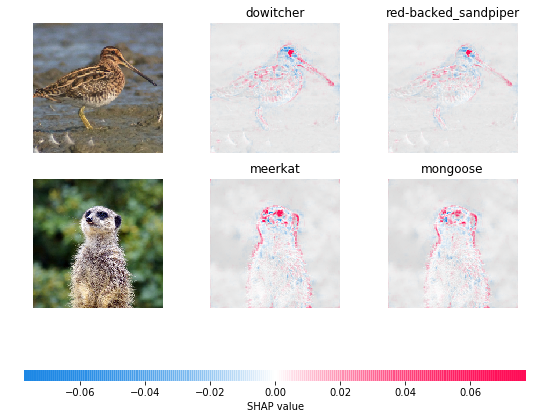
# plot the explanations
shap_values = [np.swapaxes(np.swapaxes(s, 2, 3), 1, -1) for s in shap_values]
shap.image_plot(shap_values, to_explain, index_names)
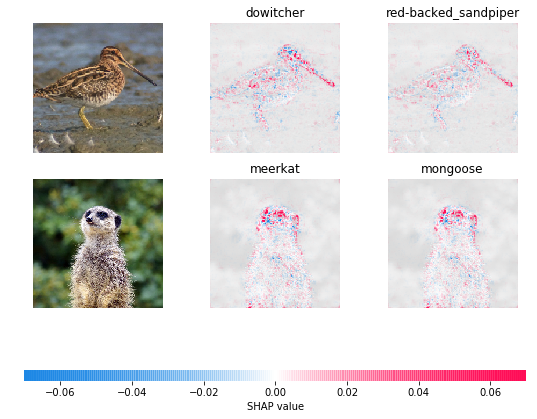
使用局部平滑进行解释
梯度解释器使用期望梯度,它将积分梯度、SHAP 和 SmoothGrad 的思想合并到一个单一的期望方程中。要像 SmoothGrad 一样使用平滑,只需将 local_smoothing 参数设置为非零值即可。这将在期望计算期间向输入添加具有该标准偏差的正态分布噪声。它可以创建更平滑的特征归因,从而更好地捕获图像的相关区域。
[4]:
# note that because the inputs are scaled to be between 0 and 1, the local smoothing also has to be
# scaled compared to the Keras model
explainer = shap.GradientExplainer((model, model.features[7]), normalize(X), local_smoothing=0.5)
shap_values, indexes = explainer.shap_values(normalize(to_explain), ranked_outputs=2, nsamples=200)

# get the names for the classes
index_names = np.vectorize(lambda x: class_names[str(x)][1])(indexes)

# plot the explanations
shap_values = [np.swapaxes(np.swapaxes(s, 2, 3), 1, -1) for s in shap_values]

shap.image_plot(shap_values, to_explain, index_names)