使用 scikit-learn 进行糖尿病回归
本示例使用与模型无关的 KernelExplainer 和 TreeExplainer 来解释在小型糖尿病数据集上训练的几种不同回归模型。此笔记本旨在提供如何将 KernelExplainer 用于各种模型的示例。
加载数据
[1]:
import time

import numpy as np
from sklearn.model_selection import train_test_split

import shap

X, y = shap.datasets.diabetes()
X_train, X_test, y_train, y_test = train_test_split(X, y, test_size=0.2, random_state=0)

# rather than use the whole training set to estimate expected values, we summarize with
# a set of weighted kmeans, each weighted by the number of points they represent.
X_train_summary = shap.kmeans(X_train, 10)


def print_accuracy(f):
    print(f"Root mean squared test error = {np.sqrt(np.mean((f(X_test) - y_test) ** 2))}")
    time.sleep(0.5)  # to let the print get out before any progress bars


shap.initjs()

线性回归
[2]:
from sklearn import linear_model

lin_regr = linear_model.LinearRegression()
lin_regr.fit(X_train, y_train)

print_accuracy(lin_regr.predict)
Root mean squared test error = 58.51766133582009
解释测试集中的单个预测
[3]:
ex = shap.KernelExplainer(lin_regr.predict, X_train_summary)
shap_values = ex.shap_values(X_test.iloc[0, :])
shap.force_plot(ex.expected_value, shap_values, X_test.iloc[0, :])
[3]:
可视化已省略,Javascript 库未加载!
您是否已在此笔记本中运行 `initjs()`?如果此笔记本来自其他用户,您还必须信任此笔记本(文件 -> 信任笔记本)。如果您在 GitHub 上查看此笔记本,则 Javascript 出于安全原因已被移除。
您是否已在此笔记本中运行 `initjs()`?如果此笔记本来自其他用户,您还必须信任此笔记本(文件 -> 信任笔记本)。如果您在 GitHub 上查看此笔记本,则 Javascript 出于安全原因已被移除。
解释测试集中的所有预测
[4]:
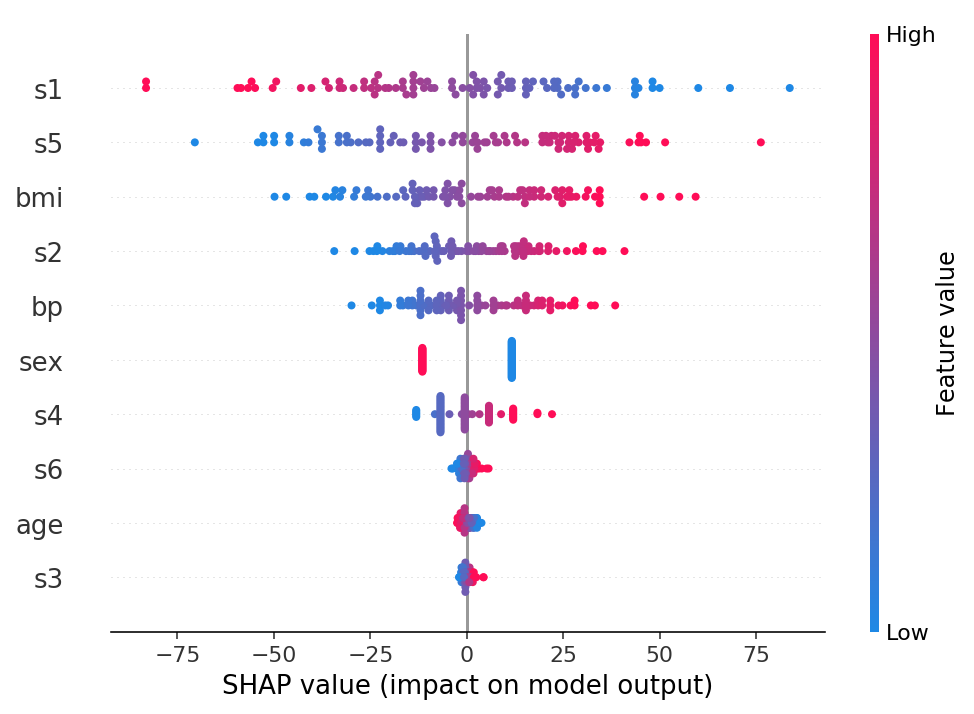
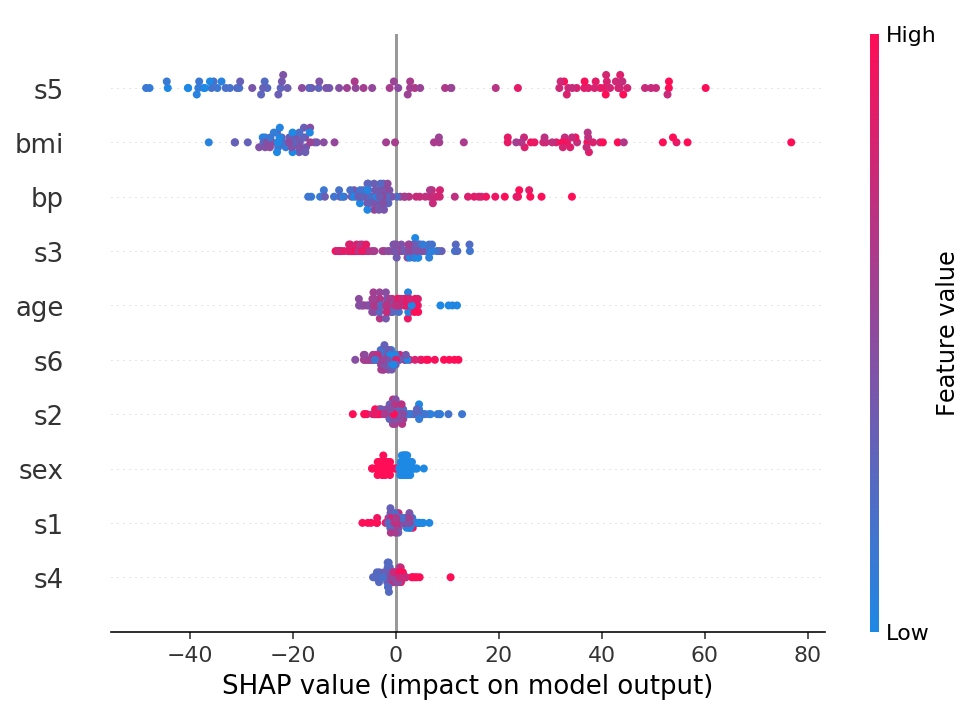
shap_values = ex.shap_values(X_test)
shap.summary_plot(shap_values, X_test)
100%|██████████| 89/89 [00:21<00:00, 4.16it/s]
[5]:
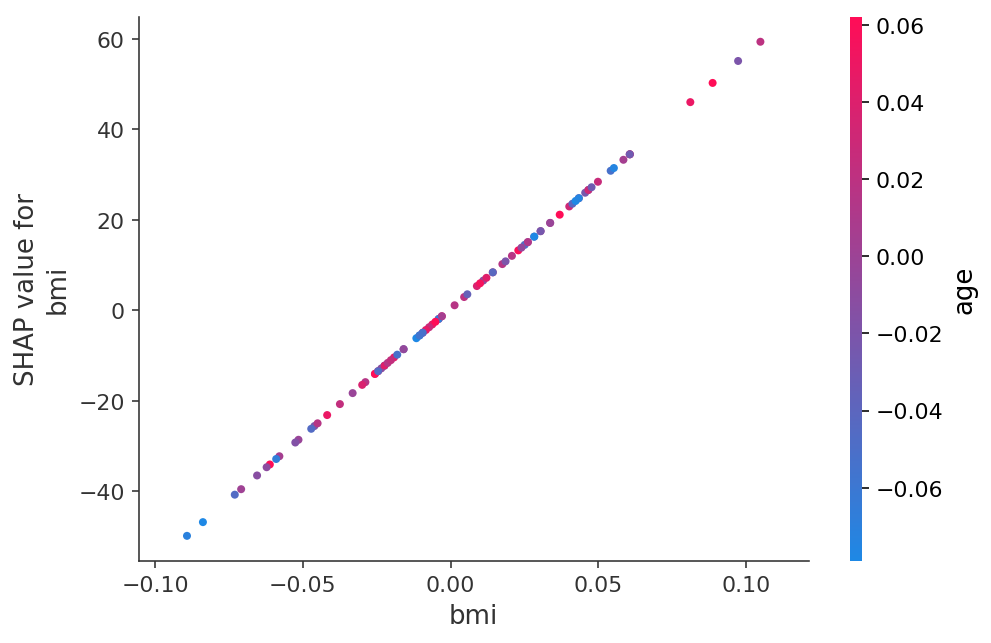
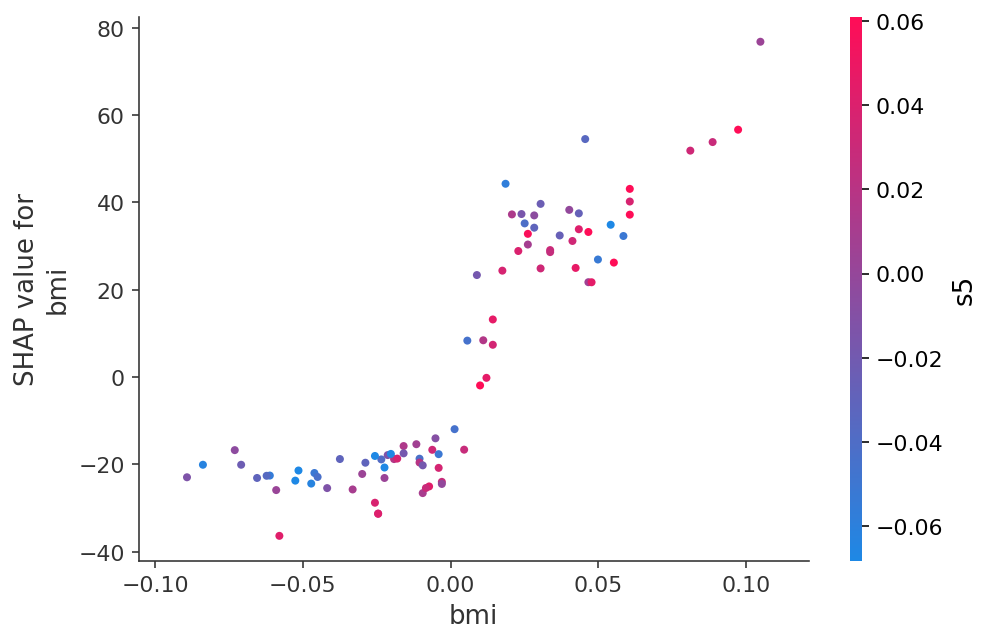
shap.dependence_plot("bmi", shap_values, X_test)
[6]:
shap.force_plot(ex.expected_value, shap_values, X_test)
[6]:
可视化已省略,Javascript 库未加载!
您是否已在此笔记本中运行 `initjs()`?如果此笔记本来自其他用户,您还必须信任此笔记本(文件 -> 信任笔记本)。如果您在 GitHub 上查看此笔记本,则 Javascript 出于安全原因已被移除。
您是否已在此笔记本中运行 `initjs()`?如果此笔记本来自其他用户,您还必须信任此笔记本(文件 -> 信任笔记本)。如果您在 GitHub 上查看此笔记本,则 Javascript 出于安全原因已被移除。
决策树回归器
[7]:
from sklearn import tree

dtree = tree.DecisionTreeRegressor(min_samples_split=20)
dtree.fit(X_train, y_train)
print_accuracy(dtree.predict)

# explain all the predictions in the test set
ex = shap.TreeExplainer(dtree)
shap_values = ex.shap_values(X_test)
shap.summary_plot(shap_values, X_test)
Root mean squared test error = 71.98699151013147
[8]:
shap.dependence_plot("bmi", shap_values, X_test)
[9]:
shap.force_plot(ex.expected_value, shap_values, X_test)
[9]:
可视化已省略,Javascript 库未加载!
您是否已在此笔记本中运行 `initjs()`?如果此笔记本来自其他用户,您还必须信任此笔记本(文件 -> 信任笔记本)。如果您在 GitHub 上查看此笔记本,则 Javascript 出于安全原因已被移除。
您是否已在此笔记本中运行 `initjs()`?如果此笔记本来自其他用户,您还必须信任此笔记本(文件 -> 信任笔记本)。如果您在 GitHub 上查看此笔记本,则 Javascript 出于安全原因已被移除。
随机森林
使用快速的 TreeExplainer 实现。
[10]:
from sklearn.ensemble import RandomForestRegressor

rforest = RandomForestRegressor(n_estimators=1000, max_depth=None, min_samples_split=2, random_state=0)
rforest.fit(X_train, y_train)
print_accuracy(rforest.predict)

# explain all the predictions in the test set
explainer = shap.TreeExplainer(rforest)
shap_values = explainer.shap_values(X_test)
shap.summary_plot(shap_values, X_test)
Root mean squared test error = 61.24795842972228
[11]:
shap.dependence_plot("bmi", shap_values, X_test)
[12]:
shap.force_plot(explainer.expected_value, shap_values, X_test)
[12]:
可视化已省略,Javascript 库未加载!
您是否已在此笔记本中运行 `initjs()`?如果此笔记本来自其他用户,您还必须信任此笔记本(文件 -> 信任笔记本)。如果您在 GitHub 上查看此笔记本,则 Javascript 出于安全原因已被移除。
您是否已在此笔记本中运行 `initjs()`?如果此笔记本来自其他用户,您还必须信任此笔记本(文件 -> 信任笔记本)。如果您在 GitHub 上查看此笔记本,则 Javascript 出于安全原因已被移除。
神经网络
[13]:
from sklearn.neural_network import MLPRegressor
nn = MLPRegressor(solver="lbfgs", alpha=1e-1, hidden_layer_sizes=(5, 2), random_state=0)
nn.fit(X_train, y_train)
print_accuracy(nn.predict)
# explain all the predictions in the test set
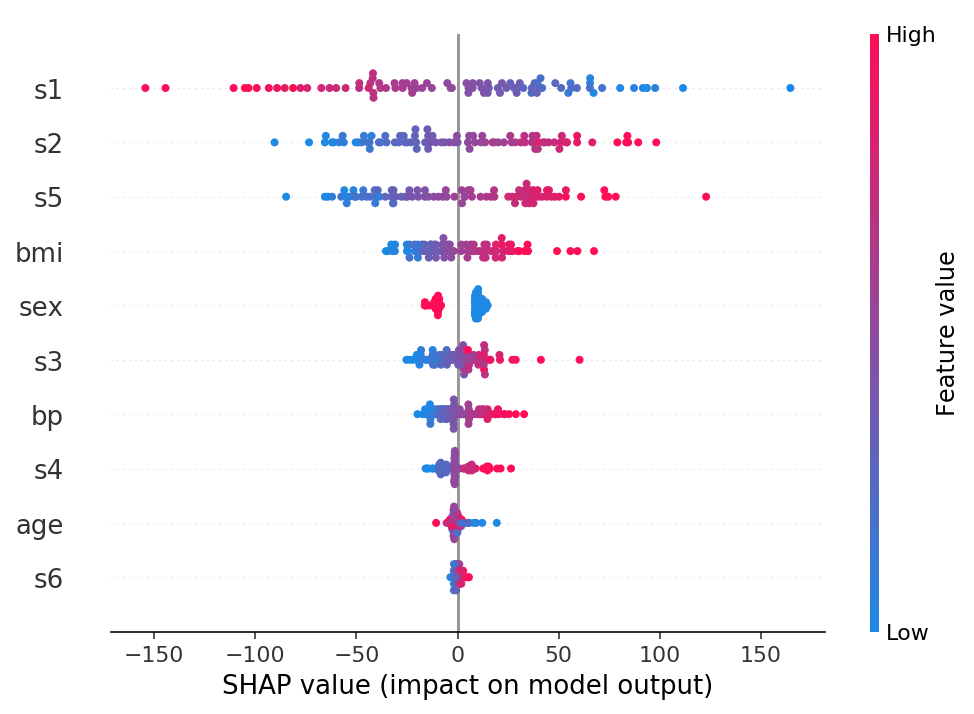
explainer = shap.KernelExplainer(nn.predict, X_train_summary)
shap_values = explainer.shap_values(X_test)
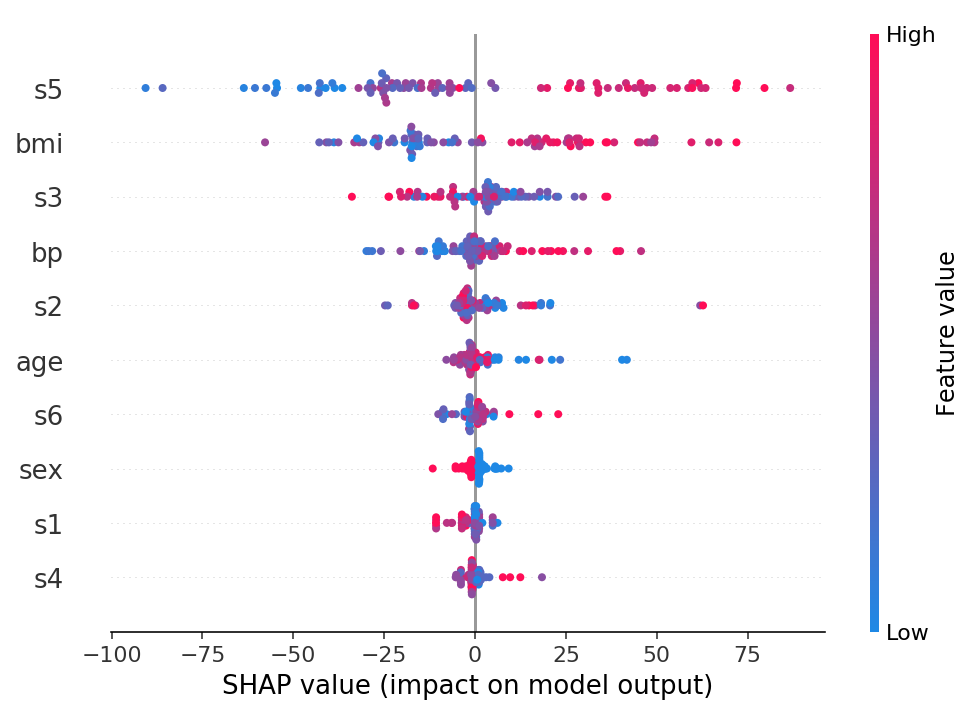
shap.summary_plot(shap_values, X_test)
Root mean squared test error = 58.517105754085364
100%|██████████| 89/89 [00:19<00:00, 4.65it/s]
[14]:
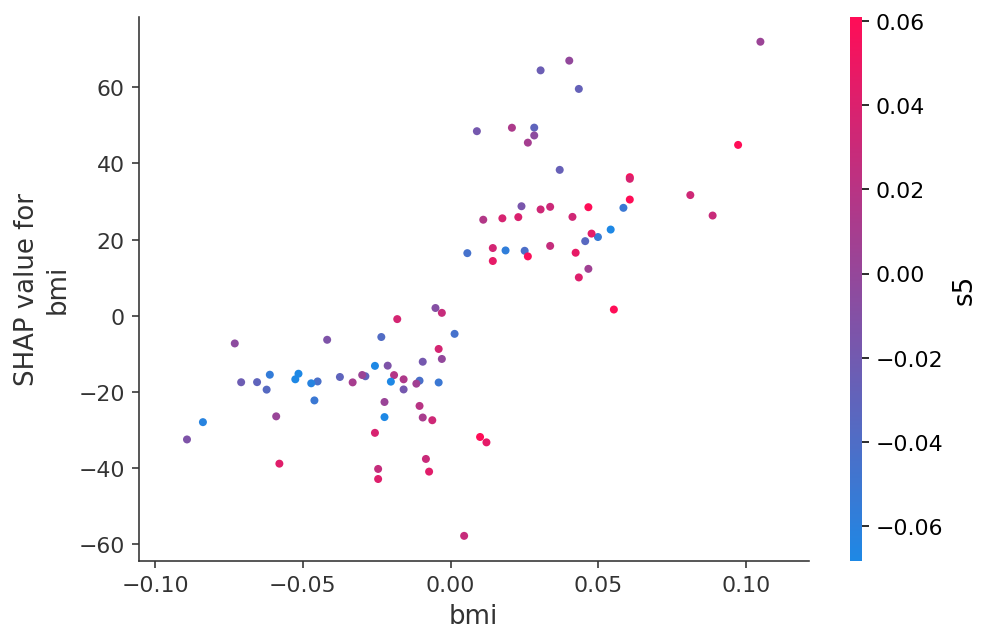
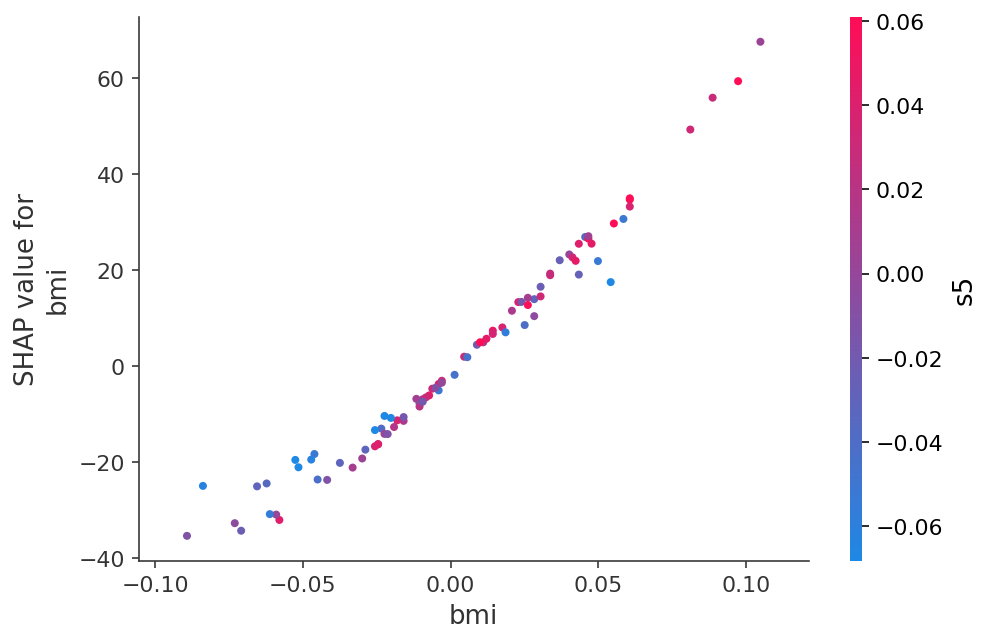
shap.dependence_plot("bmi", shap_values, X_test)
[15]:
shap.force_plot(explainer.expected_value, shap_values, X_test)
[15]:
可视化已省略,Javascript 库未加载!
您是否已在此笔记本中运行 `initjs()`?如果此笔记本来自其他用户,您还必须信任此笔记本(文件 -> 信任笔记本)。如果您在 GitHub 上查看此笔记本,则 Javascript 出于安全原因已被移除。
您是否已在此笔记本中运行 `initjs()`?如果此笔记本来自其他用户,您还必须信任此笔记本(文件 -> 信任笔记本)。如果您在 GitHub 上查看此笔记本,则 Javascript 出于安全原因已被移除。