多输出回归模型的 SHAP 值
作者:coryroyce
更新日期:2021年3月4日
创建多输出回归模型
创建数据
导入所需包
[1]:
import pandas as pd
from keras.layers import Dense
from keras.models import Sequential
from sklearn.datasets import make_regression
创建一个生成多输出回归数据的自定义函数。注意:本示例创建了5个输出/目标/标签,但该方法可轻松扩展至任意数量的输出。
[2]:
def get_dataset():
    # Create sample data with sklearn make_regression function
    X, y = make_regression(n_samples=1000, n_features=10, n_informative=7, n_targets=5, random_state=0)

    # Convert the data into Pandas Dataframes for easier maniplution and keeping stored column names
    # Create feature column names
    feature_cols = [
        "feature_01",
        "feature_02",
        "feature_03",
        "feature_04",
        "feature_05",
        "feature_06",
        "feature_07",
        "feature_08",
        "feature_09",
        "feature_10",
    ]

    df_features = pd.DataFrame(data=X, columns=feature_cols)

    # Create lable column names and dataframe
    label_cols = ["labels_01", "labels_02", "labels_03", "labels_04", "labels_05"]

    df_labels = pd.DataFrame(data=y, columns=label_cols)

    return df_features, df_labels
创建模型
创建一个 Tensorflow/Keras 序贯模型。
[3]:
def get_model(n_inputs, n_outputs):
    model = Sequential()
    model.add(Dense(32, input_dim=n_inputs, kernel_initializer="he_uniform", activation="relu"))
    model.add(Dense(n_outputs, kernel_initializer="he_uniform"))
    model.compile(loss="mae", optimizer="adam")
    return model
训练模型
使用上面定义的函数创建数据集。
[4]:
# Create the datasets
X, y = get_dataset()

# Get the number of inputs and outputs from the dataset
n_inputs, n_outputs = X.shape[1], y.shape[1]
使用上面定义的函数加载模型。
[5]:
model = get_model(n_inputs, n_outputs)
训练模型
[6]:
model.fit(X, y, verbose=0, epochs=100)
[6]:
<tensorflow.python.keras.callbacks.History at 0x7f08e9a7e490>
获取模型评估指标以确认训练效果良好。
[7]:
model.evaluate(x=X, y=y)
32/32 [==============================] - 0s 826us/step - loss: 15.8952
[7]:
15.895209312438965
模型预测
可以手动输入数据,但在本例中,我们仅使用特征/X 数据中的一个任意索引。
[8]:
model.predict(X.iloc[0:1, :])
[8]:
array([[ -15.026388,  -64.4412  ,  -75.39472 ,  -70.4628  , -126.55638 ]],
      dtype=float32)
获取 SHAP 值和图表
将 Shapley 值应用于模型。
[9]:
!pip install shap
import shap

# print the JS visualization code to the notebook
shap.initjs()
Collecting shap
  Downloading https://files.pythonhosted.org/packages/b9/f4/c5b95cddae15be80f8e58b25edceca105aa83c0b8c86a1edad24a6af80d3/shap-0.39.0.tar.gz (356kB)
     |████████████████████████████████| 358kB 6.0MB/s
Requirement already satisfied: numpy in /usr/local/lib/python3.7/dist-packages (from shap) (1.19.5)
Requirement already satisfied: scipy in /usr/local/lib/python3.7/dist-packages (from shap) (1.4.1)
Requirement already satisfied: scikit-learn in /usr/local/lib/python3.7/dist-packages (from shap) (0.22.2.post1)
Requirement already satisfied: pandas in /usr/local/lib/python3.7/dist-packages (from shap) (1.1.5)
Requirement already satisfied: tqdm>4.25.0 in /usr/local/lib/python3.7/dist-packages (from shap) (4.41.1)
Collecting slicer==0.0.7
  Downloading https://files.pythonhosted.org/packages/78/c2/b3f55dfdb8af9812fdb9baf70cacf3b9e82e505b2bd4324d588888b81202/slicer-0.0.7-py3-none-any.whl
Requirement already satisfied: numba in /usr/local/lib/python3.7/dist-packages (from shap) (0.51.2)
Requirement already satisfied: cloudpickle in /usr/local/lib/python3.7/dist-packages (from shap) (1.3.0)
Requirement already satisfied: joblib>=0.11 in /usr/local/lib/python3.7/dist-packages (from scikit-learn->shap) (1.0.1)
Requirement already satisfied: python-dateutil>=2.7.3 in /usr/local/lib/python3.7/dist-packages (from pandas->shap) (2.8.1)
Requirement already satisfied: pytz>=2017.2 in /usr/local/lib/python3.7/dist-packages (from pandas->shap) (2018.9)
Requirement already satisfied: setuptools in /usr/local/lib/python3.7/dist-packages (from numba->shap) (54.0.0)
Requirement already satisfied: llvmlite<0.35,>=0.34.0.dev0 in /usr/local/lib/python3.7/dist-packages (from numba->shap) (0.34.0)
Requirement already satisfied: six>=1.5 in /usr/local/lib/python3.7/dist-packages (from python-dateutil>=2.7.3->pandas->shap) (1.15.0)
Building wheels for collected packages: shap
  Building wheel for shap (setup.py) ... done
  Created wheel for shap: filename=shap-0.39.0-cp37-cp37m-linux_x86_64.whl size=491624 sha256=d4d0a19e515d857230caed0cc9bd7ad48017557ad8d72898297455efe78376ea
  Stored in directory: /root/.cache/pip/wheels/15/27/f5/a8ab9da52fd159aae6477b5ede6eaaec69fd130fa0fa59f283
Successfully built shap
Installing collected packages: slicer, shap
Successfully installed shap-0.39.0 slicer-0.0.7

这里我们使用上面训练的 Keras 模型,并解释为什么它对单个样本会做出不同的预测。
使用 Kernel Explainer(SHAP 中与模型无关的解释器方法)设置解释器。
[10]:
explainer = shap.KernelExplainer(model=model.predict, data=X.head(50), link="identity")
获取单个样本的 Shapley 值。
[11]:
# Set the index of the specific example to explain
X_idx = 0

shap_value_single = explainer.shap_values(X=X.iloc[X_idx : X_idx + 1, :], nsamples=100)
显示单个样本的详细信息
[12]:
X.iloc[X_idx : X_idx + 1, :]
[12]:
| 特征_01 | 特征_02 | 特征_03 | 特征_04 | 特征_05 | 特征_06 | 特征_07 | 特征_08 | 特征_09 | 特征_10 | |
|---|---|---|---|---|---|---|---|---|---|---|
| 0 | -0.093555 | 0.417854 | -1.655827 | -2.048833 | -0.258209 | -0.989744 | -0.154596 | -0.338294 | 1.503827 | -0.514878 |
选择要进行单独解释的标签/输出/目标
注意:下拉菜单可以轻松替换为手动设置要解释的标签索引。
[13]:
import ipywidgets as widgets
[14]:
# Create the list of all labels for the drop down list
list_of_labels = y.columns.to_list()

# Create a list of tuples so that the index of the label is what is returned
tuple_of_labels = list(zip(list_of_labels, range(len(list_of_labels))))

# Create a widget for the labels and then display the widget
current_label = widgets.Dropdown(options=tuple_of_labels, value=0, description="Select Label:")

# Display the dropdown list (Note: access index value with 'current_label.value')
current_label
绘制单个样本和单个标签/输出/目标的力图
[15]:
# print the JS visualization code to the notebook
shap.initjs()

print(f"Current label Shown: {list_of_labels[current_label.value]}")

shap.force_plot(
    base_value=explainer.expected_value[current_label.value],
    shap_values=shap_value_single[current_label.value],
    features=X.iloc[X_idx : X_idx + 1, :],
)
Current label Shown: labels_01
[15]:
可视化省略,Javascript 库未加载!
你是否已在此 notebook 中运行 `initjs()`?如果此 notebook 来自其他用户,你还必须信任此 notebook (文件 -> 信任 notebook)。如果你在 github 上查看此 notebook,则 Javascript 已为安全起见被剥离。如果你正在使用 JupyterLab,此错误是因为尚未编写 JupyterLab 扩展。
你是否已在此 notebook 中运行 `initjs()`?如果此 notebook 来自其他用户,你还必须信任此 notebook (文件 -> 信任 notebook)。如果你在 github 上查看此 notebook,则 Javascript 已为安全起见被剥离。如果你正在使用 JupyterLab,此错误是因为尚未编写 JupyterLab 扩展。
为特定输出/标签/目标创建摘要图。
[16]:
# Note: We are limiting to the first 50 training examples since it takes time to calculate the full number of sampels
shap_values = explainer.shap_values(X=X.iloc[0:50, :], nsamples=100)
[17]:
# print the JS visualization code to the notebook
shap.initjs()

print(f"Current Label Shown: {list_of_labels[current_label.value]}\n")

shap.summary_plot(shap_values=shap_values[current_label.value], features=X.iloc[0:50, :])
Current Label Shown: labels_01
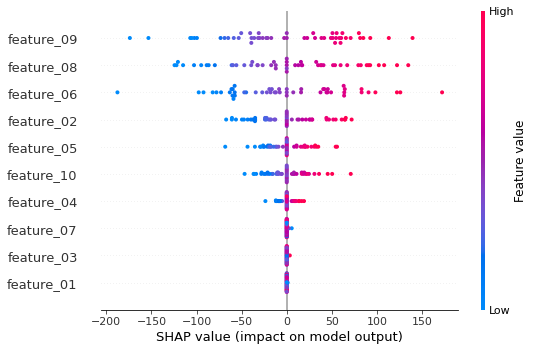
摘要图说明
根据上面的摘要图,我们可以看到特征01、03和07是对模型没有影响的特征,可以被移除(请注意,在数据设置中,我们选择了10个特征,其中只有7个与标签/目标有有意义的关系)。这是 SHAP 的巨大优势,因为没有它,我们就很难洞察哪些特征真正在影响我们的模型。
上面带有下拉菜单的设置允许我们选择要更详细地探索的单个标签。
前50个单个样本的力图。
[18]:
print(f"Current Label Shown: {list_of_labels[current_label.value]}\n")

# print the JS visualization code to the notebook
shap.initjs()

shap.force_plot(
    base_value=explainer.expected_value[current_label.value],
    shap_values=shap_values[current_label.value],
    features=X.iloc[0:50, :],
)
Current Label Shown: labels_01
[18]:
可视化省略,Javascript 库未加载!
你是否已在此 notebook 中运行 `initjs()`?如果此 notebook 来自其他用户,你还必须信任此 notebook (文件 -> 信任 notebook)。如果你在 github 上查看此 notebook,则 Javascript 已为安全起见被剥离。如果你正在使用 JupyterLab,此错误是因为尚未编写 JupyterLab 扩展。
你是否已在此 notebook 中运行 `initjs()`?如果此 notebook 来自其他用户,你还必须信任此 notebook (文件 -> 信任 notebook)。如果你在 github 上查看此 notebook,则 Javascript 已为安全起见被剥离。如果你正在使用 JupyterLab,此错误是因为尚未编写 JupyterLab 扩展。
参考
多输出回归模型的格式/构建主要基于用于多输出回归的深度学习模型