Catboost 教程
在本教程中,我们使用 catboost 进行基于树的梯度提升。
您可以使用 pip 安装 catboost
pip install catboost
或者使用 conda 安装
conda install -c conda-forge catboost
[1]:
import catboost
from catboost import CatBoostClassifier, CatBoostRegressor

import shap

shap.initjs()

让我们首先探索具有数值特征的数据集的 shap 值。
[2]:
X, y = shap.datasets.california(n_points=500)
[3]:
model = CatBoostRegressor(iterations=300, learning_rate=0.1, random_seed=123)
model.fit(X, y, verbose=False, plot=False)
[3]:
<catboost.core.CatBoostRegressor at 0x13fe19db0>
[4]:
explainer = shap.TreeExplainer(model)
shap_values = explainer(X)

# visualize the first prediction's explanation
shap.plots.force(shap_values[0, ...])
[4]:
您是否在本笔记本中运行了 `initjs()`?如果此笔记本来自其他用户,您还必须信任此笔记本(文件 -> 信任笔记本)。如果您在 github 上查看此笔记本,则 Javascript 已被剥离以确保安全。如果您使用的是 JupyterLab,则此错误是因为 JupyterLab 扩展尚未编写。
上面的解释显示了每个特征如何贡献于将模型输出从基值(我们传递的训练数据集上的平均模型输出)推向模型输出。将预测推高的特征以红色显示,将预测推低的特征以蓝色显示。
如果我们采用许多如上所示的解释,将它们旋转 90 度,然后水平堆叠它们,我们可以看到整个数据集的解释(在笔记本中,此图是交互式的)
[5]:
# visualize the training set predictions
shap.plots.force(shap_values)
[5]:
您是否在本笔记本中运行了 `initjs()`?如果此笔记本来自其他用户,您还必须信任此笔记本(文件 -> 信任笔记本)。如果您在 github 上查看此笔记本,则 Javascript 已被剥离以确保安全。如果您使用的是 JupyterLab,则此错误是因为 JupyterLab 扩展尚未编写。
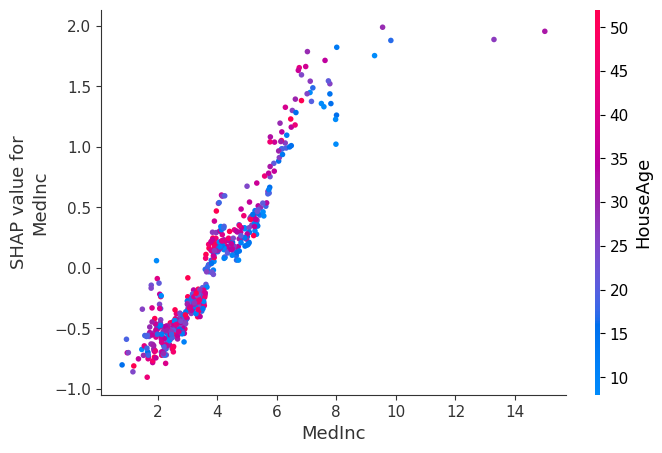
为了理解单个特征如何影响模型的输出,我们可以绘制该特征的 SHAP 值与数据集中所有示例的特征值。由于 SHAP 值表示特征对模型输出变化的责任,因此下图表示预测房价的变化,因为 MedInc (街区组的收入中位数)发生变化。单个 Medinc 值处的垂直离散表示与其他特征的交互效应。
在此依赖图中,我们选择了 HouseAge (街区组的房屋年龄中位数)特征进行着色,从中我们可以观察到
在较低的
MedInc(比如 <=4)下,HouseAge对房价没有强烈的影响(或者至少,依赖关系不是很清楚)。在较高的
MedInc下,较旧的房屋往往有较高的价格(我们通常可以看到,对于相同的MedInc,红点高于蓝点)。
[6]:
# create a SHAP dependence plot to show the effect of a single feature across the whole dataset
shap.dependence_plot("MedInc", shap_values.values, X, interaction_index="HouseAge")
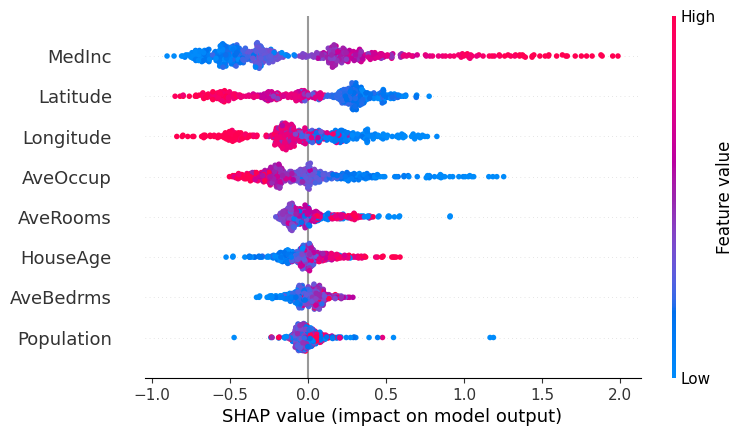
为了概览哪些特征对模型最重要,我们可以绘制每个样本的每个特征的 SHAP 值。下图按所有样本的 SHAP 值大小之和对特征进行排序,并使用 SHAP 值显示每个特征对模型输出的影响分布。颜色表示特征值(红色高,蓝色低)。这揭示了例如,高 MedInc(街区组的收入中位数)会增加预测的房价。
[7]:
# summarize the effects of all the features
shap.plots.beeswarm(shap_values)
您还可以使用 SHAP 值来分析分类特征的重要性。
[8]:
import catboost.datasets

train_df, test_df = catboost.datasets.amazon()
y = train_df.ACTION
X = train_df.drop("ACTION", axis=1)
cat_features = list(range(0, X.shape[1]))
[9]:
model = CatBoostClassifier(iterations=300, learning_rate=0.1, random_seed=12)
model.fit(X, y, cat_features=cat_features, verbose=False, plot=False)
[9]:
<catboost.core.CatBoostClassifier at 0x13ff33220>
[10]:
explainer = shap.TreeExplainer(model)
shap_values = explainer(X, y)
这是一个正例和一个负例的特征重要性可视化。请注意,二元分类输出是一个不在 [0,1] 范围内的值。您需要计算 sigmoid 函数值,以计算最终概率。
[11]:
test_objects = [X.iloc[0:1], X.iloc[91:92]]

for obj in test_objects:
    print(f"Probability of class 1 = {model.predict_proba(obj)[0][1]:.4f}")
    print("Formula raw prediction = {:.4f}".format(model.predict(obj, prediction_type="RawFormulaVal")[0]))
    print("\n")
Probability of class 1 = 0.9970
Formula raw prediction = 5.8130


Probability of class 1 = 0.0229
Formula raw prediction = -3.7539
[12]:
shap.plots.force(shap_values[0, ...])
[12]:
您是否在本笔记本中运行了 `initjs()`?如果此笔记本来自其他用户,您还必须信任此笔记本(文件 -> 信任笔记本)。如果您在 github 上查看此笔记本,则 Javascript 已被剥离以确保安全。如果您使用的是 JupyterLab,则此错误是因为 JupyterLab 扩展尚未编写。
[13]:
shap.plots.force(shap_values[91, ...])
[13]:
您是否在本笔记本中运行了 `initjs()`?如果此笔记本来自其他用户,您还必须信任此笔记本(文件 -> 信任笔记本)。如果您在 github 上查看此笔记本,则 Javascript 已被剥离以确保安全。如果您使用的是 JupyterLab,则此错误是因为 JupyterLab 扩展尚未编写。
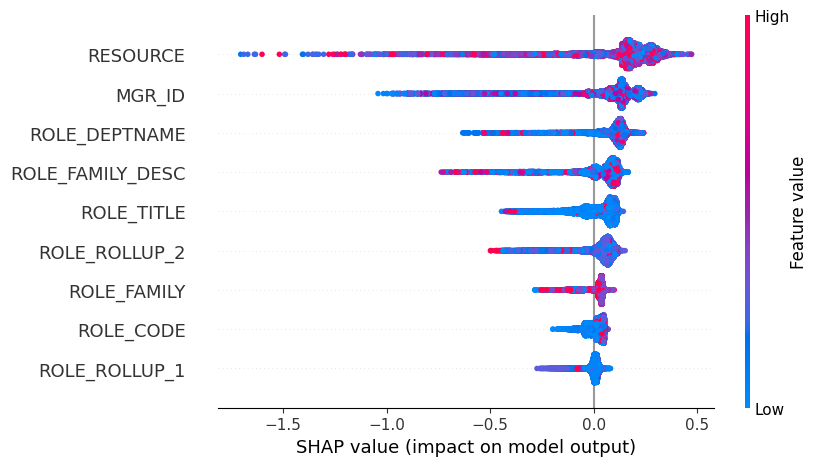
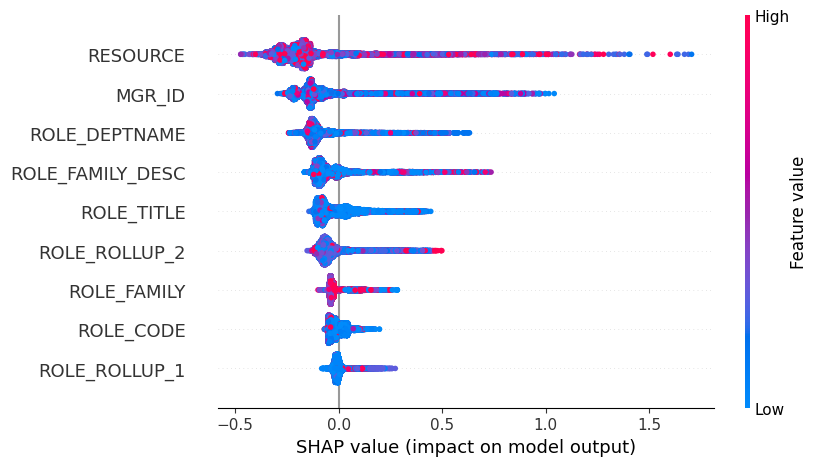
在下面的蜜蜂群图中,您可以看到特征的绝对值并不重要,因为它是哈希值。但从图中可以清楚地看出不同特征的影响。
[14]:
shap.plots.beeswarm(shap_values)
您可以计算多类别的 SHAP 值。
[15]:
model = CatBoostClassifier(loss_function="MultiClass", iterations=300, learning_rate=0.1, random_seed=123)
model.fit(X, y, cat_features=cat_features, verbose=False, plot=False)
[15]:
<catboost.core.CatBoostClassifier at 0x14037a080>
[16]:
explainer = shap.TreeExplainer(model)
shap_values = explainer(X, y)
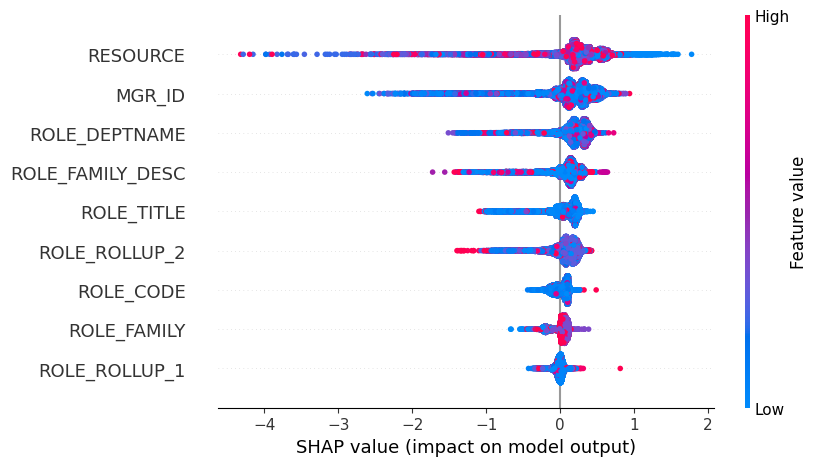
类别 0 的公式原始预测的 SHAP 值汇总图。
[17]:
shap.plots.beeswarm(shap_values[..., 0])
以及类别 1 的力图。
[18]:
shap.plots.beeswarm(shap_values[..., 1])