首页示例 (XGBoost)
使用 XGBoost 的首页示例代码。
[1]:
import xgboost
import shap
# train an XGBoost model
X, y = shap.datasets.california()
model = xgboost.XGBRegressor().fit(X, y)
# explain the model's predictions using SHAP
# (same syntax works for LightGBM, CatBoost, scikit-learn, transformers, Spark, etc.)
explainer = shap.Explainer(model)
shap_values = explainer(X)
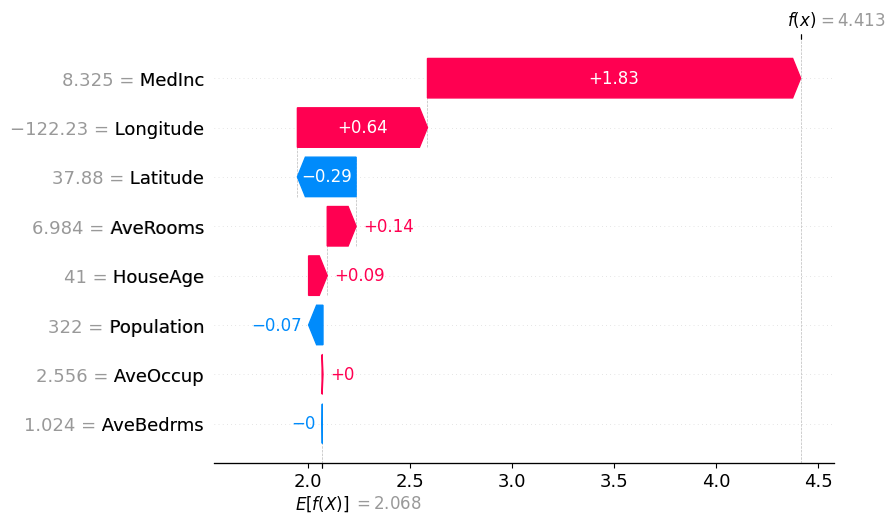
# visualize the first prediction's explanation
shap.plots.waterfall(shap_values[0])
is_sparse is deprecated and will be removed in a future version. Check `isinstance(dtype, pd.SparseDtype)` instead.
is_categorical_dtype is deprecated and will be removed in a future version. Use isinstance(dtype, CategoricalDtype) instead
is_categorical_dtype is deprecated and will be removed in a future version. Use isinstance(dtype, CategoricalDtype) instead
is_categorical_dtype is deprecated and will be removed in a future version. Use isinstance(dtype, CategoricalDtype) instead
[2]:
shap.plots.initjs()

[3]:
# visualize the first prediction's explanation with a force plot
shap.plots.force(shap_values[0])
[3]:
可视化已省略,未加载 Javascript 库!
您是否在此 notebook 中运行了 `initjs()`?如果此 notebook 来自其他用户,您还必须信任此 notebook(文件 -> 信任 notebook)。如果您在 github 上查看此 notebook,则 Javascript 已被剥离以确保安全。如果您正在使用 JupyterLab,则此错误是因为尚未编写 JupyterLab 扩展。
您是否在此 notebook 中运行了 `initjs()`?如果此 notebook 来自其他用户,您还必须信任此 notebook(文件 -> 信任 notebook)。如果您在 github 上查看此 notebook,则 Javascript 已被剥离以确保安全。如果您正在使用 JupyterLab,则此错误是因为尚未编写 JupyterLab 扩展。
[4]:
# visualize all the training set predictions
shap.plots.force(shap_values[:500])
[4]:
可视化已省略,未加载 Javascript 库!
您是否在此 notebook 中运行了 `initjs()`?如果此 notebook 来自其他用户,您还必须信任此 notebook(文件 -> 信任 notebook)。如果您在 github 上查看此 notebook,则 Javascript 已被剥离以确保安全。如果您正在使用 JupyterLab,则此错误是因为尚未编写 JupyterLab 扩展。
您是否在此 notebook 中运行了 `initjs()`?如果此 notebook 来自其他用户,您还必须信任此 notebook(文件 -> 信任 notebook)。如果您在 github 上查看此 notebook,则 Javascript 已被剥离以确保安全。如果您正在使用 JupyterLab,则此错误是因为尚未编写 JupyterLab 扩展。
[5]:
# create a dependence scatter plot to show the effect of a single feature across the whole dataset
shap.plots.scatter(shap_values[:, "Latitude"], color=shap_values)
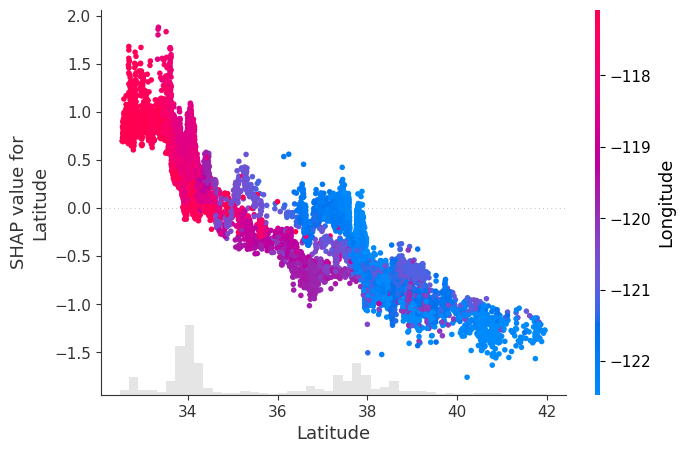
[6]:
# create a dependence scatter plot to show the effect of a single feature across the whole dataset
shap.plots.scatter(shap_values[:, "Latitude"], color=shap_values)

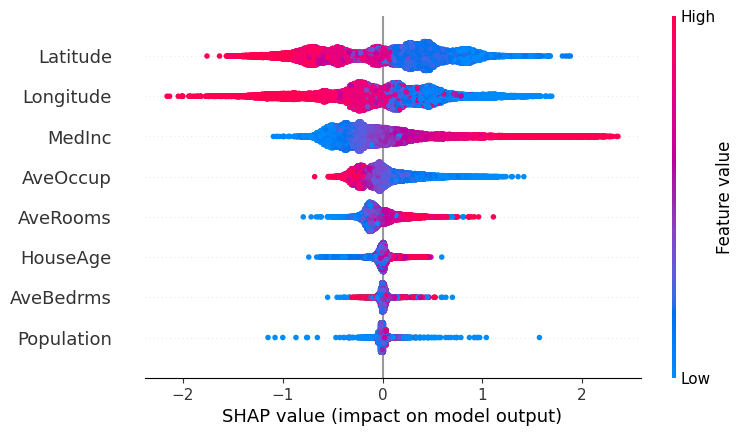
[7]:
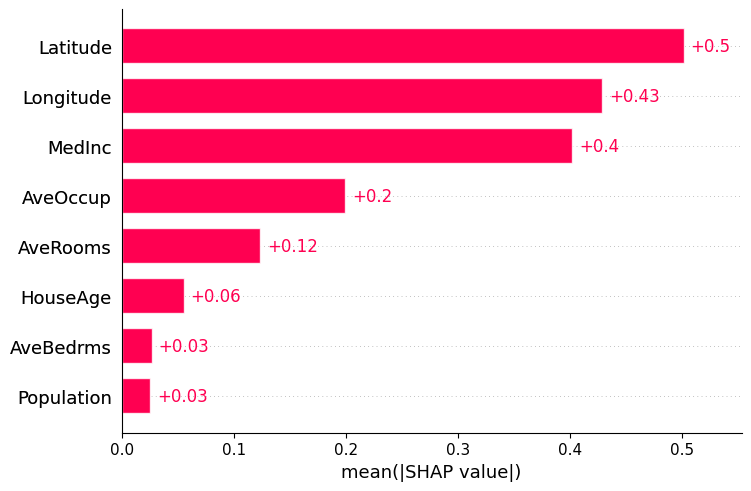
# summarize the effects of all the features
shap.plots.beeswarm(shap_values)
[8]:
shap.plots.bar(shap_values)