使用 XGBoost 拟合线性模拟
此 notebook 使用 shap 来演示当我们将其拟合到模拟数据时 XGBoost 的行为,其中标签与特征具有线性关系。
[1]:
import numpy as np
import sklearn
import xgboost
from sklearn.model_selection import train_test_split

import shap
/Users/slundberg/anaconda3/lib/python3.7/site-packages/sklearn/ensemble/weight_boosting.py:29: DeprecationWarning: numpy.core.umath_tests is an internal NumPy module and should not be imported. It will be removed in a future NumPy release.
  from numpy.core.umath_tests import inner1d
构建具有二元标签的模拟数据集
[2]:
N = 10000
M = 10
np.random.seed(0)
X = np.random.randn(N, M)
beta = np.random.randn(M)
y_margin = X @ beta
y = y_margin

X_train, X_test, y_train, y_test = train_test_split(X, y)
X_strain, X_valid, y_strain, y_valid = train_test_split(X_train, y_train)
构建 XGBoost 回归器
训练深度为 1 的模型
[3]:
model_depth1 = xgboost.XGBRegressor(
    max_depth=1,
    learning_rate=0.01,
    subsample=0.5,
    n_estimators=10000,
    base_score=y_strain.mean(),
)
model_depth1.fit(
    X_strain,
    y_strain,
    eval_set=[(X_valid, y_valid)],
    eval_metric="logloss",
    verbose=1000,
    early_stopping_rounds=20,
)
[0]     validation_0-logloss:-1.6359
Will train until validation_0-logloss hasn't improved in 20 rounds.
[1000]  validation_0-logloss:-45.6925
Stopping. Best iteration:
[1395]  validation_0-logloss:-47.0788
[3]:
XGBRegressor(base_score=0.013271975120564434, booster='gbtree',
       colsample_bylevel=1, colsample_bytree=1, gamma=0,
       learning_rate=0.01, max_delta_step=0, max_depth=1,
       min_child_weight=1, missing=None, n_estimators=10000, n_jobs=1,
       nthread=None, objective='reg:linear', random_state=0, reg_alpha=0,
       reg_lambda=1, scale_pos_weight=1, seed=None, silent=True,
       subsample=0.5)
训练深度为 3 的模型
[4]:
model_depth3 = xgboost.XGBRegressor(
    learning_rate=0.02,
    subsample=0.2,
    colsample_bytree=0.5,
    n_estimators=5000,
    base_score=y_strain.mean(),
)
model_depth3.fit(
    X_strain,
    y_strain,
    eval_set=[(X_valid, y_valid)],
    eval_metric="logloss",
    verbose=500,
    early_stopping_rounds=20,
)
[0]     validation_0-logloss:-13.3182
Will train until validation_0-logloss hasn't improved in 20 rounds.
[500]   validation_0-logloss:-48.8915
Stopping. Best iteration:
[612]   validation_0-logloss:-49.0554
[4]:
XGBRegressor(base_score=0.013271975120564434, booster='gbtree',
       colsample_bylevel=1, colsample_bytree=0.5, gamma=0,
       learning_rate=0.02, max_delta_step=0, max_depth=3,
       min_child_weight=1, missing=None, n_estimators=5000, n_jobs=1,
       nthread=None, objective='reg:linear', random_state=0, reg_alpha=0,
       reg_lambda=1, scale_pos_weight=1, seed=None, silent=True,
       subsample=0.2)
解释深度为 1 的模型
[6]:
shap_values = shap.TreeExplainer(model_depth1).shap_values(X_test)
shap_interaction_values = shap.TreeExplainer(model_depth1).shap_interaction_values(X_test)
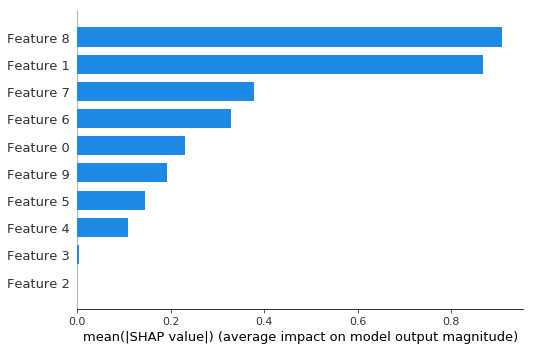
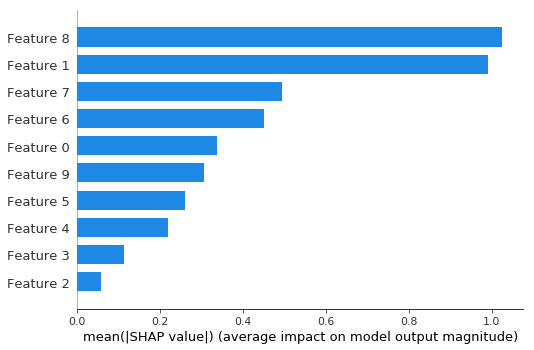
摘要条形图显示每个特征的全局重要性
[7]:
shap.summary_plot(shap_values, X_test, plot_type="bar")
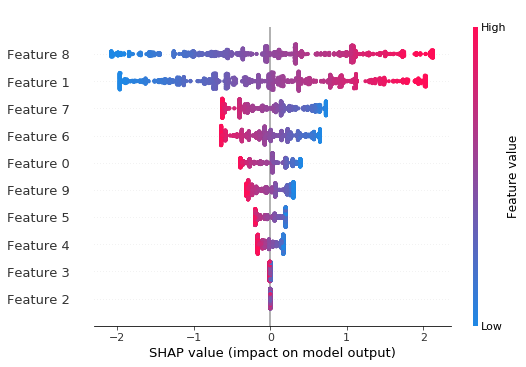
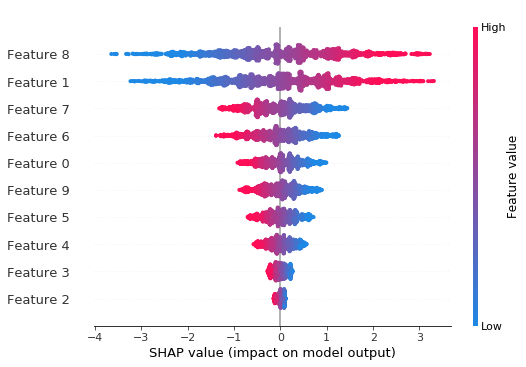
摘要蜜蜂群图显示每个特征的全局重要性和效应量的大小分布
[8]:
shap.summary_plot(shap_values, X_test)
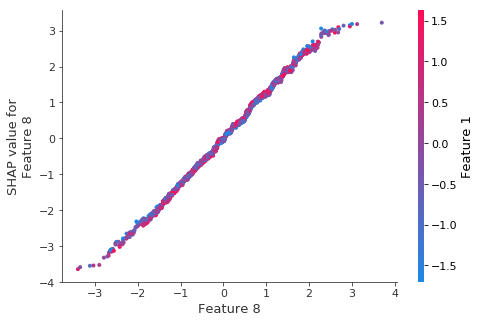
顶部特征的依赖图显示 XGBoost 捕获了大部分线性关系
重要的是要注意,XGBoost(和其他梯度提升树模型)偏向于平坦区域,这可以从下面线性函数的扁平尾部看出。
[9]:
shap.dependence_plot(8, shap_values, X_test)

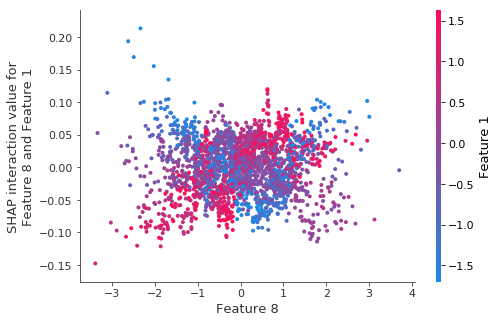
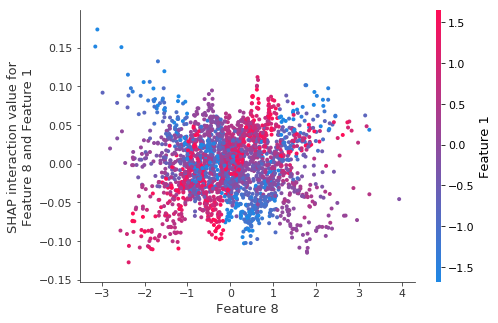
正如预期的那样,深度为 1 的模型没有交互作用
我们也可以从上面依赖图中缺乏任何垂直离散度看出这一点。
[10]:
shap.dependence_plot((8, 1), shap_interaction_values, X_test)

尾部扁平化行为在所有其他特征中都是一致的。
[11]:
shap.dependence_plot(1, shap_values, X_test)
/Users/slundberg/anaconda3/lib/python3.7/site-packages/numpy/lib/function_base.py:2400: RuntimeWarning: invalid value encountered in true_divide
  c /= stddev[:, None]
/Users/slundberg/anaconda3/lib/python3.7/site-packages/numpy/lib/function_base.py:2401: RuntimeWarning: invalid value encountered in true_divide
  c /= stddev[None, :]
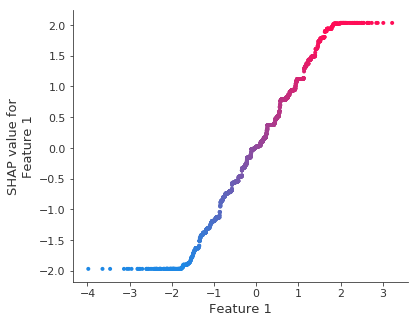
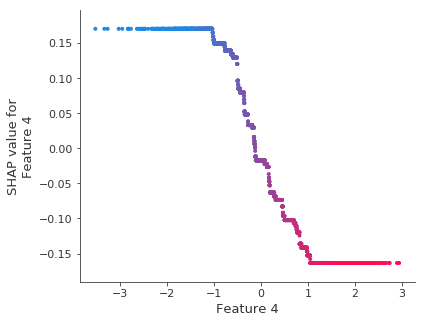
请注意,较弱的信号会导致拟合中更多的变异性
由于 XGBoost 喜欢平坦区域,因此变异性通常看起来像阶跃函数。请记住,在下面的图中,SHAP 值正确地告诉您模型学到了什么,但模型并没有学习到平滑的线。
[12]:
shap.dependence_plot(4, shap_values, X_test)
/Users/slundberg/anaconda3/lib/python3.7/site-packages/numpy/lib/function_base.py:2400: RuntimeWarning: invalid value encountered in true_divide
  c /= stddev[:, None]
/Users/slundberg/anaconda3/lib/python3.7/site-packages/numpy/lib/function_base.py:2401: RuntimeWarning: invalid value encountered in true_divide
  c /= stddev[None, :]
解释深度为 3 的模型
在这个模拟中,我们知道真实的关系是线性的,没有任何交互作用。但是,当我们拟合深度大于 1 的树时,我们是在告诉模型寻找交互作用。当我们解释深度为 3 的模型时,我们看到它确实学到了一些微弱的(不正确的)交互作用。
[13]:
e3 = shap.TreeExplainer(model_depth3)
shap_values3 = e3.shap_values(X_test)
shap_interaction_values3 = shap.TreeExplainer(model_depth3).shap_interaction_values(X_test)
全局重要性的条形图与深度为 1 的基本相同。
[14]:
shap.summary_plot(shap_values3, X_test, plot_type="bar")
蜜蜂群摘要图比深度为 1 的模型更平滑(请参阅依赖图以了解原因)。
[15]:
shap.summary_plot(shap_values3, X_test)
来自深度为 3 的树的垂直交互离散度平滑了任何小步骤。
这就是使蜜蜂群摘要图看起来更均匀的原因。还要注意,当我们按特征 1 着色时,我们似乎看到了持续的交互作用效果。
[16]:
shap.dependence_plot(8, shap_values3, X_test)
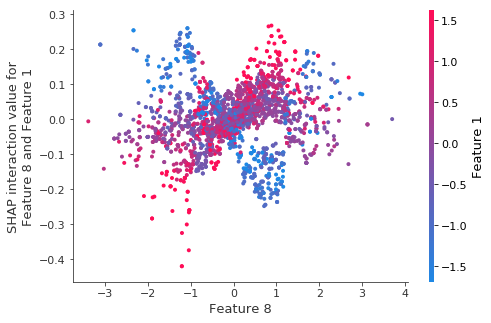
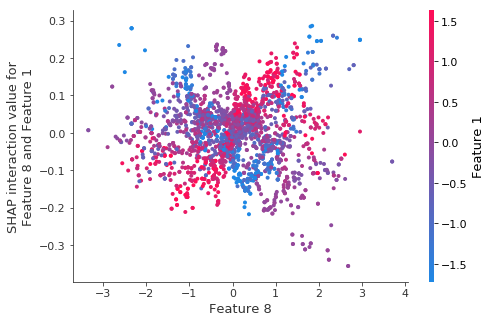
如果我们更仔细地观察并绘制 6 和 1 之间的交互值,我们会看到一个看似清晰的模式
[17]:
shap.dependence_plot((8, 1), shap_interaction_values3, X_test)
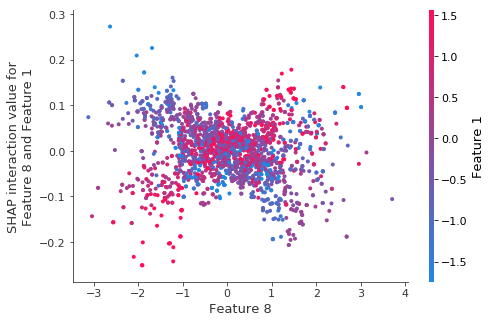
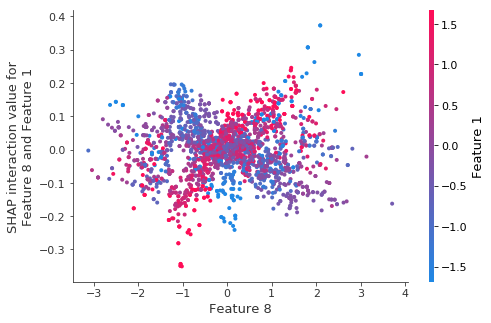
在新的数据集上观察到相同的交互作用效果
这意味着模型确实学到了这种交互作用,即使那里没有交互作用可学习。我们如何保护自己免于跳到这是真实交互作用的结论?(不使用我们模拟了这个数据的事实)
[18]:
X_tmp = np.random.randn(*X_test.shape)
tmp_values = shap.TreeExplainer(model_depth3).shap_interaction_values(X_tmp)
shap.dependence_plot((8, 1), tmp_values, X_tmp)
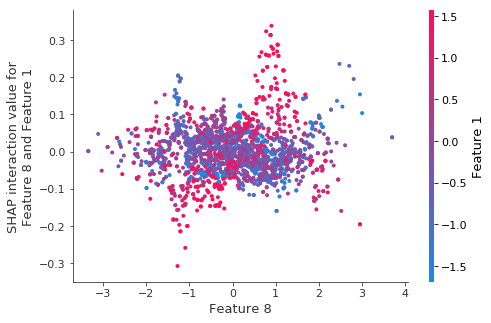
重新训练模型相同的交互作用。
当我们对自举重采样重新训练模型时,结构(即使很少)似乎消失了。
[19]:
for i in range(5):
    print(i)
    X_strain_tmp, y_strain_tmp = sklearn.utils.resample(X_strain, y_strain)
    X_valid_tmp, y_valid_tmp = sklearn.utils.resample(X_valid, y_valid)
    X_test_tmp, y_test_tmp = sklearn.utils.resample(X_test, y_test)

    model_tmp = xgboost.XGBRegressor(learning_rate=0.01, subsample=0.5, n_estimators=5000, base_score=y_strain.mean())
    model_tmp.fit(
        X_strain_tmp,
        y_strain_tmp,
        eval_set=[(X_valid_tmp, y_valid_tmp)],
        eval_metric="logloss",
        verbose=500,
        early_stopping_rounds=20,
    )

    tmp_values = shap.TreeExplainer(model_tmp).shap_interaction_values(X_test_tmp)
    shap.dependence_plot((8, 1), tmp_values, X_test_tmp)
0
[0]     validation_0-logloss:-15.2753
Will train until validation_0-logloss hasn't improved in 20 rounds.
[500]   validation_0-logloss:-46.3412
Stopping. Best iteration:
[532]   validation_0-logloss:-46.6178
1
[0]     validation_0-logloss:-10.6659
Will train until validation_0-logloss hasn't improved in 20 rounds.
[500]   validation_0-logloss:-48.2467
[1000]  validation_0-logloss:-49.8021
Stopping. Best iteration:
[984]   validation_0-logloss:-49.8074
2
[0]     validation_0-logloss:-14.5348
Will train until validation_0-logloss hasn't improved in 20 rounds.
[500]   validation_0-logloss:-46.558
[1000]  validation_0-logloss:-48.0845
Stopping. Best iteration:
[1310]  validation_0-logloss:-48.3214
3
[0]     validation_0-logloss:-15.4186
Will train until validation_0-logloss hasn't improved in 20 rounds.
[500]   validation_0-logloss:-47.0986
Stopping. Best iteration:
[946]   validation_0-logloss:-48.5674
4
[0]     validation_0-logloss:-13.7396
Will train until validation_0-logloss hasn't improved in 20 rounds.
[500]   validation_0-logloss:-47.5456
Stopping. Best iteration:
[755]   validation_0-logloss:-48.7873
可视化单个预测
[31]:
shap.initjs()

[32]:
e3 = shap.TreeExplainer(model_depth3)
t = e3.shap_values(X_test)
[33]:
shap.force_plot(e3.expected_value, shap_values[0, :], X_test[0, :])
[33]:
可视化已省略,Javascript 库未加载!
您是否在此 notebook 中运行了 `initjs()`?如果此 notebook 来自其他用户,您还必须信任此 notebook(文件 -> 信任 notebook)。如果您在 github 上查看此 notebook,则 Javascript 已被剥离以确保安全。如果您正在使用 JupyterLab,则此错误是因为尚未编写 JupyterLab 扩展程序。
您是否在此 notebook 中运行了 `initjs()`?如果此 notebook 来自其他用户,您还必须信任此 notebook(文件 -> 信任 notebook)。如果您在 github 上查看此 notebook,则 Javascript 已被剥离以确保安全。如果您正在使用 JupyterLab,则此错误是因为尚未编写 JupyterLab 扩展程序。
[34]:
shap.force_plot(e3.expected_value, shap_values[0:500, :], X_test[0:500, :])
[34]:
可视化已省略,Javascript 库未加载!
您是否在此 notebook 中运行了 `initjs()`?如果此 notebook 来自其他用户,您还必须信任此 notebook(文件 -> 信任 notebook)。如果您在 github 上查看此 notebook,则 Javascript 已被剥离以确保安全。如果您正在使用 JupyterLab,则此错误是因为尚未编写 JupyterLab 扩展程序。
您是否在此 notebook 中运行了 `initjs()`?如果此 notebook 来自其他用户,您还必须信任此 notebook(文件 -> 信任 notebook)。如果您在 github 上查看此 notebook,则 Javascript 已被剥离以确保安全。如果您正在使用 JupyterLab,则此错误是因为尚未编写 JupyterLab 扩展程序。
[ ]: